
image-comparator: Flip Through Folders of Plots, Side by Side
Aug 24, 2026
About:
image-comparator is a desktop application I made for viewing multiple sets of plot or image files side by side, and navigating through them synchronously with the keyboard. It is one of the tools I have found most useful in my own day to day work.

The problem it solves is the following- an analysis pipeline often writes one plot per sample into a separate folder for each type of plot. For example, some QC plots, some UMAPs and some spatial plots for every biological sample. Reviewing them means opening qc_plots/sample_07.png, then umap_plots/sample_07.pdf, then spatial_plots/sample_07.jpg, and then doing it all over again for sample 8, and so on. With image-comparator, each folder gets its own panel in a grid, and as you press the down (or up) arrow key, every panel moves to the next (or previous) sample at the same time.
Some cases where I have found it useful:
- QC next to results: checking each sample’s quality metrics alongside its downstream analysis, so that a strange cluster can be traced back to a poor quality sample.
- Before and after a change: comparing figures from two versions of a pipeline, or before and after a parameter change, to see which samples were actually affected.
- Parameter sweeps and model runs: putting the same diagnostic plot from several runs (different settings, seeds or checkpoints) in one grid and scanning through every input.
- Reviewing many figures fast: when there are hundreds of samples to check by eye, just lay out the plot types you need and hold the down arrow.
How it works:
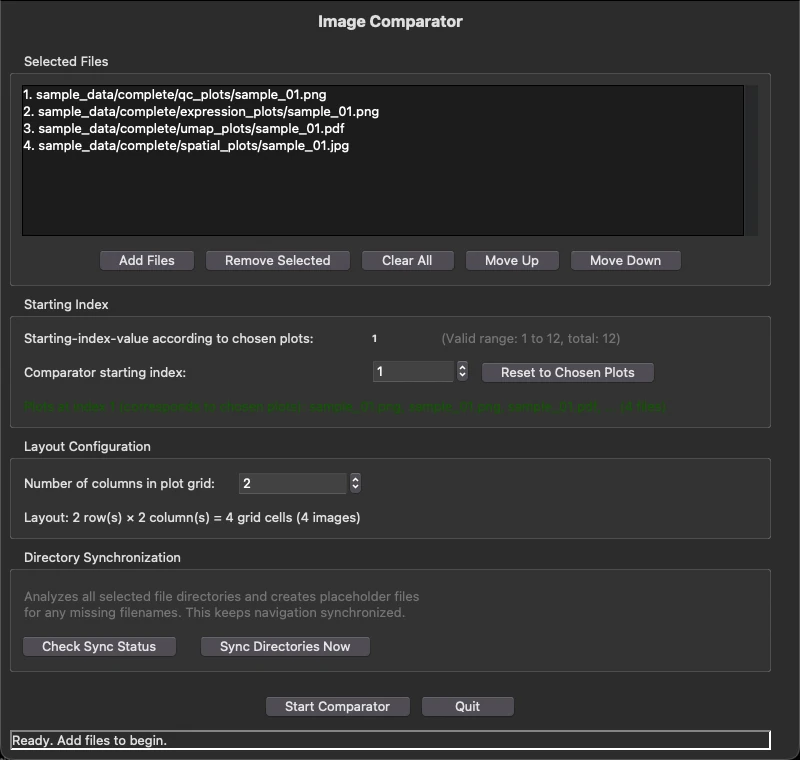
You start by choosing one plot from each folder you want to compare. The app finds all the other plots in those folders, sorts them by name, and figures out the position of each chosen plot in its folder. From there, the arrow keys move every panel forward or backward together. The panel order and the number of columns in the grid can be set in the start window.
Below is an example of stepping through samples with four different types of plots (QC histogram, marker gene expression, UMAP and a spatial map) for each sample:
Since files are matched by their position in each folder, it works best when the plots are named by the sample, and the folder name indicates the type of plot. PNG, JPEG, TIFF, BMP, GIF and PDF files are supported, and can be mixed.
Features:
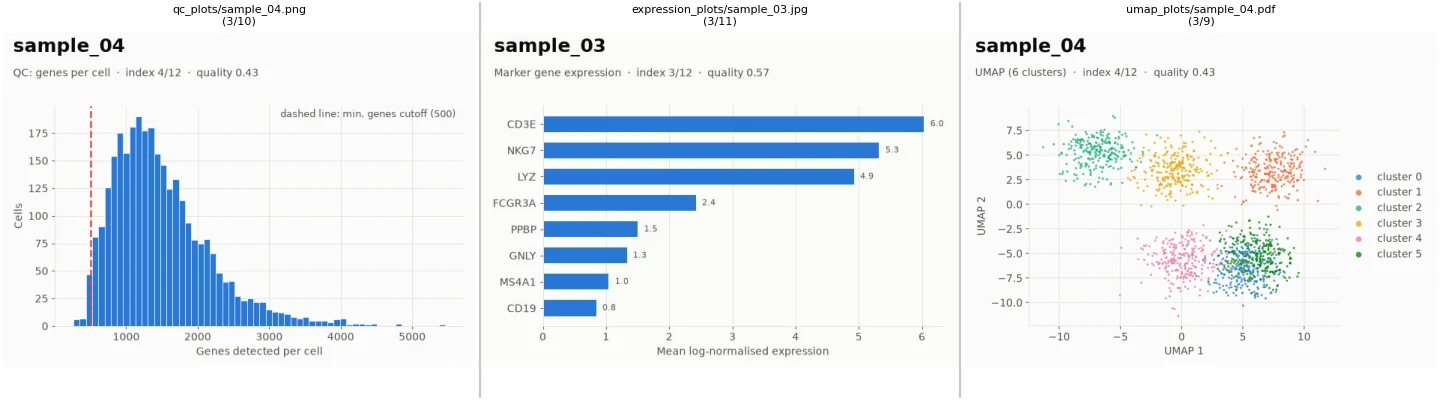
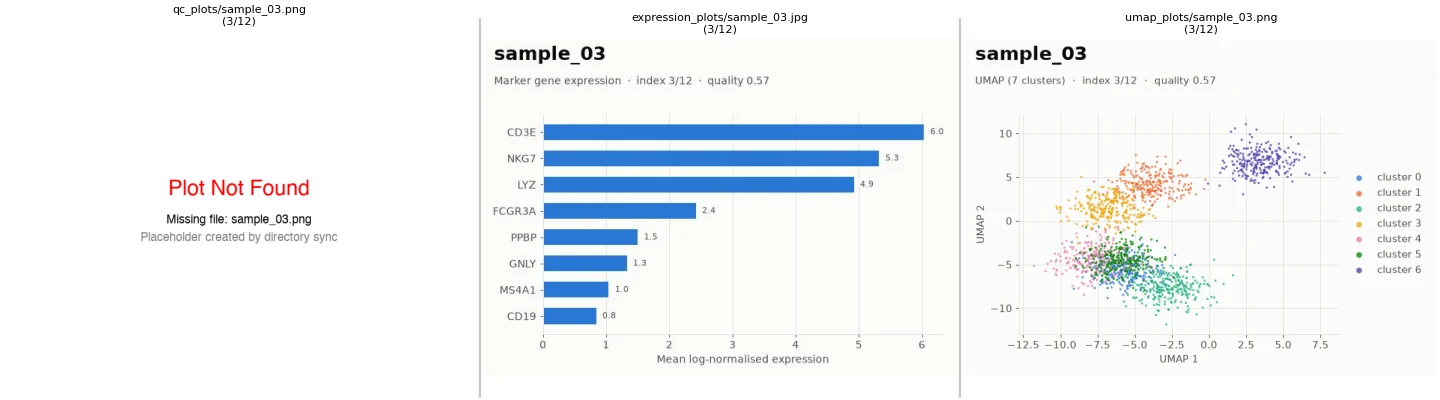
Directory synchronization: because files are matched by position, a folder with a missing sample shifts everything after it out of step. In the first image below, the middle panel shows sample_03 while the others have already moved on to sample_04. “Check Sync Status” reports which samples are missing in each folder (and any sample saved twice with different extensions), and “Sync Directories Now” creates a clearly labelled placeholder for every missing sample, so that all the folders line up again (second image).
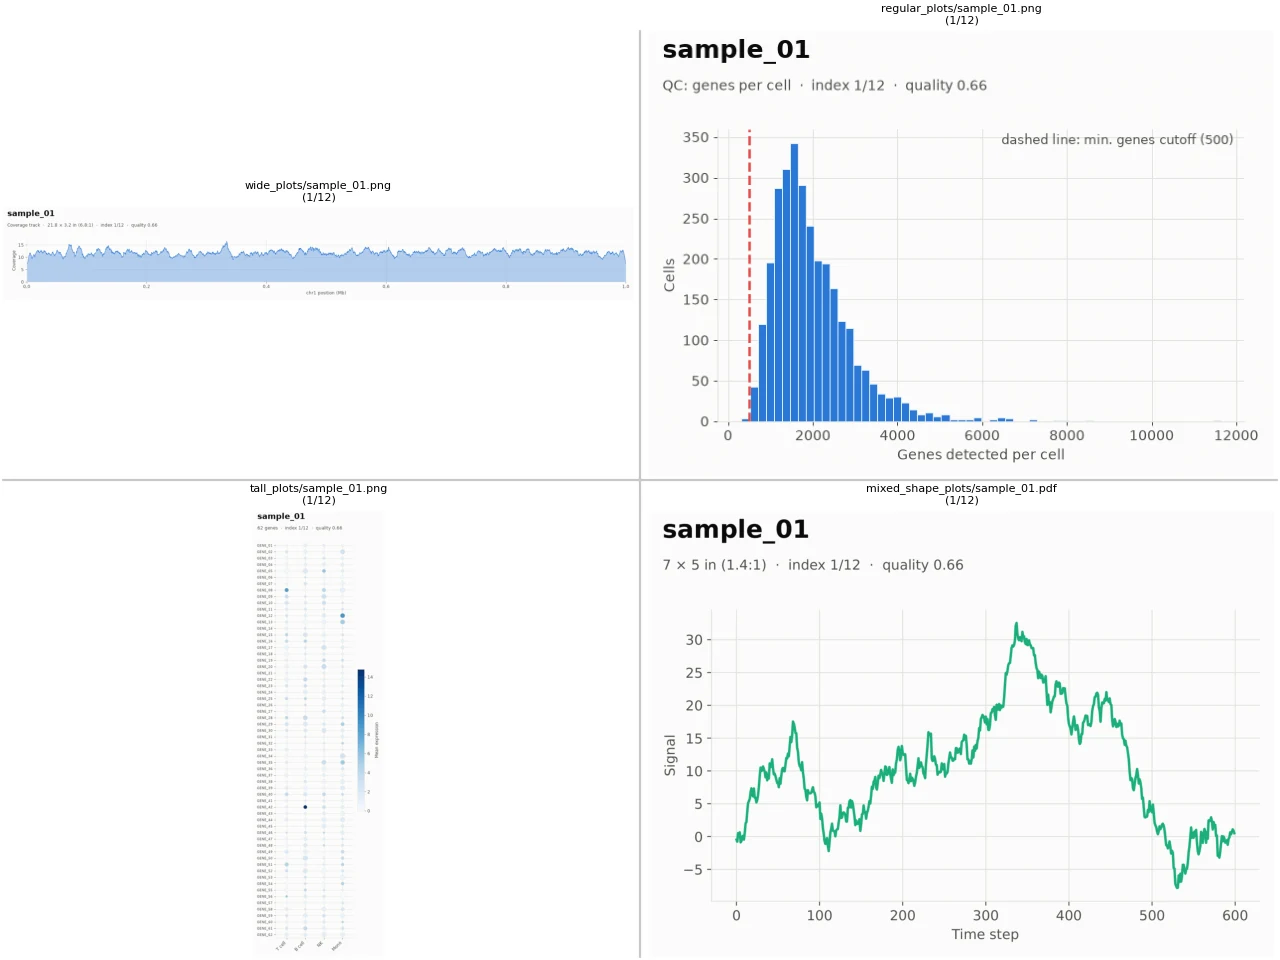
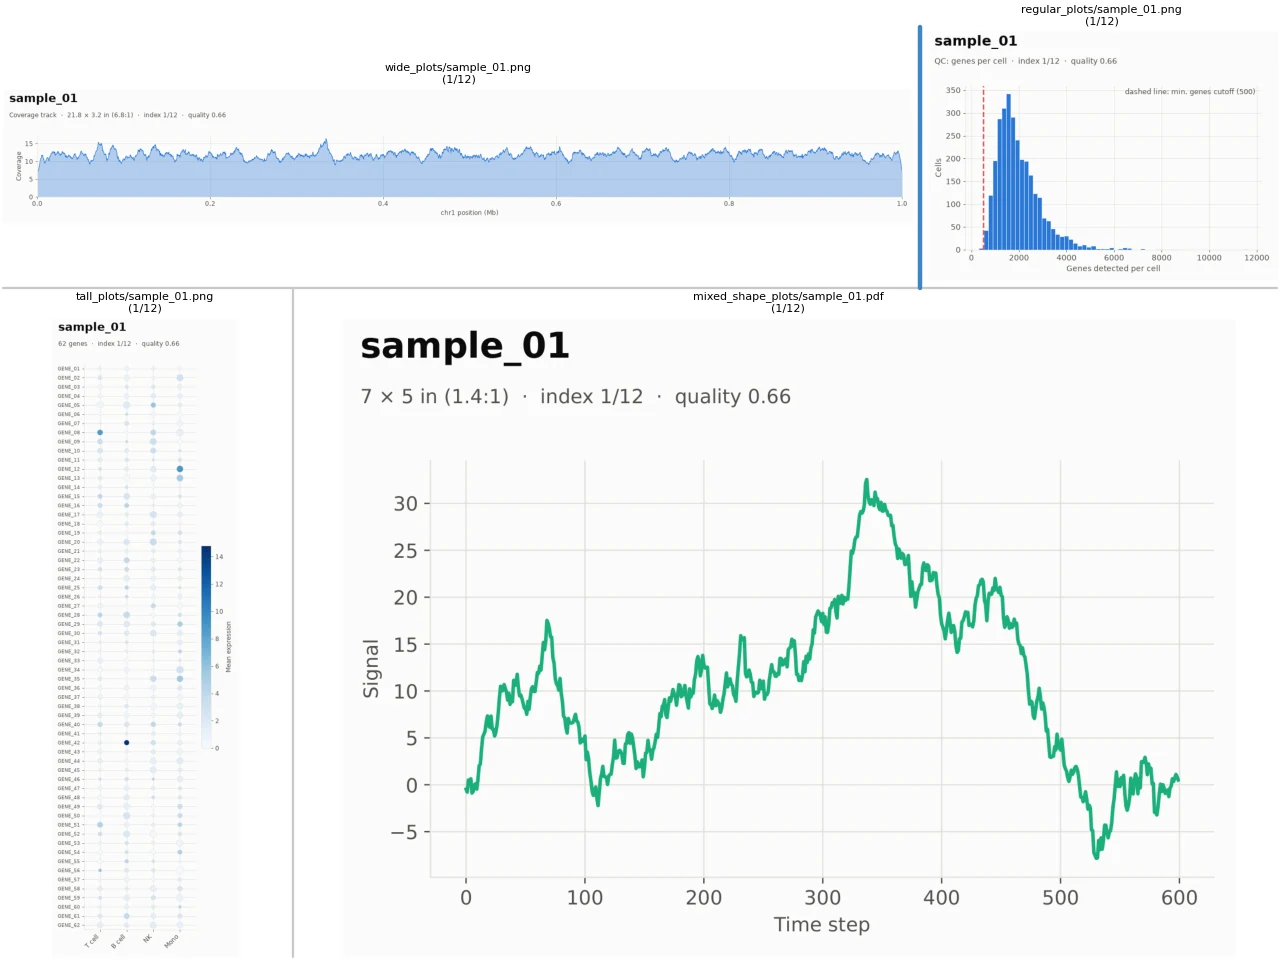
Resizing panels: plots don’t all share the same shape. A genome coverage track is very wide, a dot plot of many genes is very tall, and a legend needs hardly any room. So the gaps between panels can be dragged with the mouse to give each plot the space it needs (pressing E makes all the panels equal again). The panel sizes are kept as you navigate.
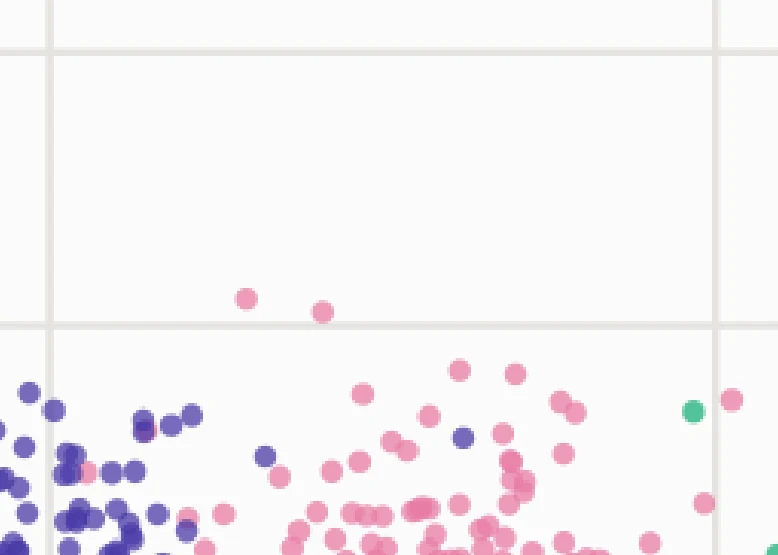
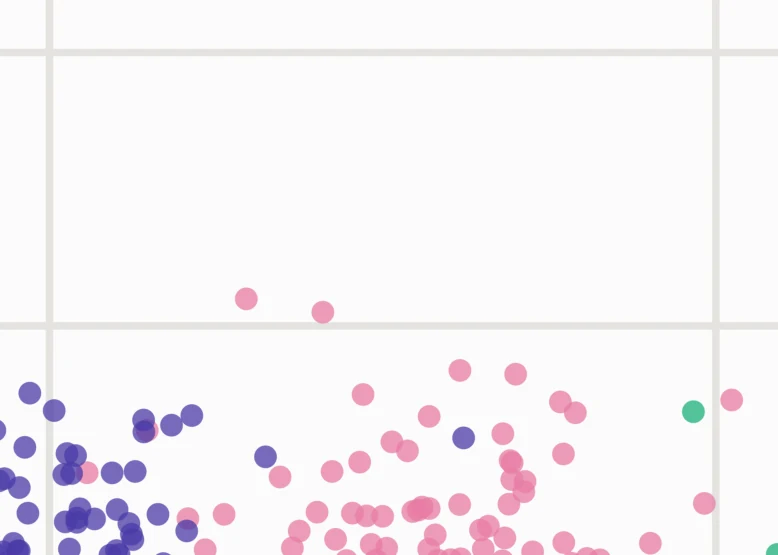
Zoom and pan, staying sharp: pressing O lets you drag a rectangle to zoom into a plot, and P lets you pan around it (H resets everything). Since PDFs are vector graphics, when you zoom into one, the visible region gets re-rendered at screen resolution a moment after you stop, so that small text and thin lines stay crisp at any zoom level. Below is a UMAP PDF zoomed in 6x, right after zooming (left) and a moment later (right).
Fast navigation: to keep stepping through heavy PDF plots fast, the PDFs for the next and previous steps are rendered in the background while you look at the current one, and recently viewed ones are kept in memory.
Implementation:
The app is written in Python, with the windows built using tkinter and the plots displayed using matplotlib. PDFs are rendered using PyMuPDF. It is published on PyPI, so it can be installed as a standalone command with pipx install image-comparator, and works on macOS, Linux and Windows. The repo also has some sample data, which can be used to try out the tool (including directory sync), and all the screenshots on this page were generated by the app from that sample data.
If you have any questions or suggestions, please feel free to email me or raise an issue on the repo. I would be very happy to hear if you find it useful!
Links:
- github link to project: https://github.com/shashkat/image-comparator
- project website (use cases and a walkthrough of each feature): https://shashkat.github.io/image-comparator/
- PyPI: https://pypi.org/project/image-comparator/