 Identifying Marker Genes for rare cell types
- 1 min 
This was the first leg of my work at TenSixty Biosciences. I was tasked with cancer subtyping. We were looking for a cell-type characterization of cancer rather than an organ characterization, which is how cancer types are generally referred to currently. Certain rare cell types (ionocytes, neuroendocrine cells, and tuft cells) are linked to cancer origination.
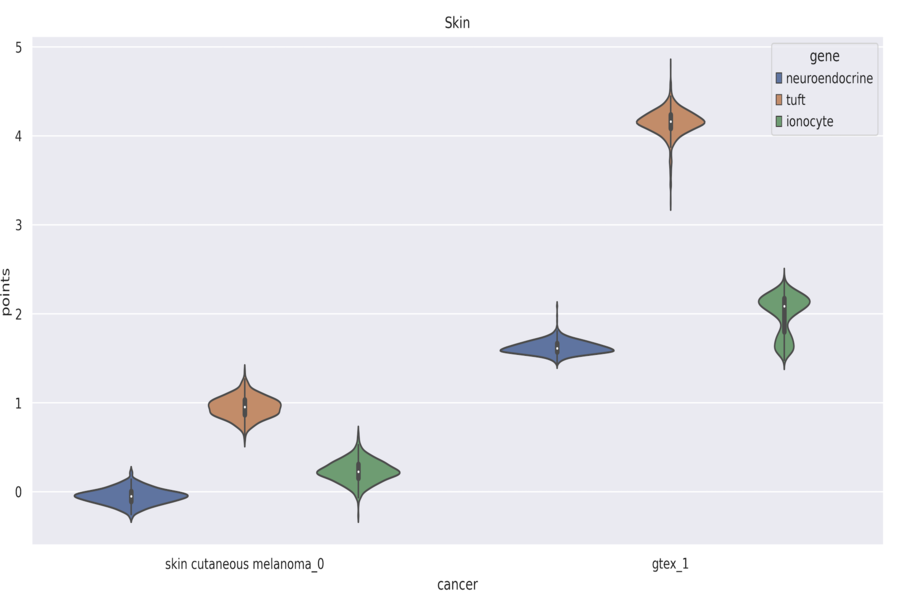
I found out the proportion of these cells in different types of cancer by first identifying the putative marker genes for them using a labeled single cell RNAseq data and then using those genes’ amount in the primary RNAseq bulk sample to find the presence of these cells. I developed a pipeline to visualize the results for 33 cancer types in our dataset (derived from TCGA) and compare them with the expression data of normal samples from the GTEX database.
Using it, one could compare the expression levels of all the cancers types (out of the 33) from a tissue with the expression levels from normal tissue, for any set of genes. Later, I expanded improved it to show expression levels at the isoform level rather than gene level. This I did by building the setup to run Kallisto (sequencing tool to process raw FASTQ files) on AWS parallel by dockerizing it and deploying the docker image on AWS parallel. Shown is an image of an example violin plot obtained using the tool.